The data analytics journey is a journey of progressively unravelling meaningful insights from the deluge of data. The journey is usually undertaken through a set of standard data driven processes that ultimately help in achieving the intended output. Cross-Industry Process for Data Mining or CRISP-DM is a robust and well-proven methodology across the industry.
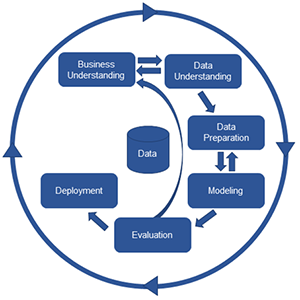
The life cycle of any analytics project consists of six phases. The sequence of the phases is not rigid. Moving back and forth between different phases is always required. The outcome of each phase determines which phase, or particular task of a phase, has to be performed next. The arrows indicate the most important and frequent dependencies between phases.
The process of analytics is cyclical in nature and does not end once a solution is deployed. The lessons learned during the process and from the deployed solution can trigger new, often more-focused business questions. Subsequent data mining processes will benefit from the experiences of previous ones. In the following, we briefly outline each phase:
Stage One – Determine Business Objectives
This is the first step in the Data Analytics Life Cycle. Invariably, the department would begin with one or more problem areas which it may want to probe and analyze and validate using the data and find a solution for the same. The problem statements may range from finding out whether the programme being implemented by the department is achieving the expected outcomes to discovering new relationships across domains so that new policies and programmes can be formulated. At this stage, the Analytics team would need to gain a comprehensive understanding of the business domain and a clear understanding of the problem that the department wishes to examine through a series of brainstorming sessions with the department officials.
Stage Two – Data Understanding
Once the business domain and the problem areas have been understood in sufficient detail, the next step would be to understand the data sets available with the department. The data may be available in a single data source or may be spread across multiple data sources within the same department or even across departments. Sometimes, data from sources outside the Government domain may also need to be used. The identified data may be well structured, semi-structured or unstructured. Preliminary examination of the data may reveal additional, hidden insights which may not have been immediately apparent to the client department. These additional insights may be shared with the department to finalize the scope of the Analytics project.
Stage Three – Data Preparation
Before deep diving into modeling, it must be understood that the insights derived from the exercise will be only as good as the data on which it is based. Data Quality is a measure of the accuracy, validity and completeness of data and forms the foundation of good analytic insights. The data preparation phase covers all activities needed to construct the final dataset [data that will be fed into the modeling tool(s)] from the initial raw data. Data preparation tasks are likely to be performed multiple times and not in any prescribed order. The extent of data preparation may vary based on the nature of model that is to be used and may include, among others, generation of new features or attributes or transformation of existing attributes.
Stage Four – Modelling
In this phase, various modeling techniques are selected and applied, and their parameters are calibrated to optimal values. Invariably a representative sample of the data is taken using appropriate sampling techniques and the model generated using appropriate statistical or machine learning algorithms. The generated model is then validated against the test data to see how closely the model depicts the real-life situation. Typically, there are several techniques for the same data mining problem type. Some techniques have specific requirements on the form of data. Therefore, going back to the data preparation phase is often necessary.
Stage Five - Evaluation
Before proceeding to final deployment of the model, it is important to thoroughly evaluate it and review the steps executed to create it, to be certain the model properly achieves the business objectives. The insights drawn from the finalized model are verified with the client to see if it is in alignment with the domain of discourse. Any anomaly pointed out by the client prompts the analytics team to go back to the drawing board to see if any issue has been overlooked. A key objective is to determine if there is some important business issue that has not been sufficiently considered. At the end of this phase, a decision on the use of the data analytics results is reached.
Stage Six – Deployment
Creation of the model is generally not the end of the project. The knowledge gained during the entire lifecycle of the project will need to be organized and presented in a way that the business can use it. The results may be presented as a report or presented in a more user-friendly manner using visualization tools. Data visualization helps in depicting the output of the analysis to the user in a visual form so that the user is able to better understand and interpret the insights thrown up by data analytics. Depending on the requirements, the deployment phase can be as simple as generating a report or as complex as implementing a repeatable data mining process across the enterprise.
