To understand the entire eco-system of data analytics, it needs to be viewed from two main dimensions:
- Data characteristics (Traditional Data vs Big Data) and
- The Analytics Escalator (solution complexity vs value)
Data Characteristics
Data can be broadly classified as Traditional data and Big Data based on three major characteristics of data: Volume, Velocity and Variety. Traditional data refers to data that are received in manageable volumes and at a manageable speed. Traditional data is also usually highly structured, most commonly in the form of a relational database and largely stored in well-defined schemas. Examples of traditional data include most of the data that are managed as part of government programmes and services.
Big data, on the other hand, is high in any one or all of the above three characteristics. In other words, Big Data usually refers to large volume of data, data received at a very high speed (streaming data) and/or data that come in a variety of structures – structured, semi-structured and unstructured formats including diverse data types such as text, video, audio, images etc.
Examples of big data include high volume databases such as those maintained by Aadhaar and GSTN, streaming, high velocity data such as inputs coming from mobile apps where crowd sourcing is used, data coming from IoT devices and variety of data such as those received from social media such as Twitter and Facebook, YouTube etc.
Due to the varying nature of the data, the way these data need to be processed and the tools required to do so also vary. Thus, Traditional Data usually uses a centralized architecture in which data processing is done by a single system such as a web application using a Relational Database Management System (RDBMS) at the backend. Invariably, powerful and costly machines are deployed to improve their performance and fault tolerance.
Because of its unique data characteristics, Big Data, on the other hand, is generally processed in a distributed manner with hundreds, sometimes thousands of commodity hardware (low cost systems). The parallel processing of the data enables much faster processing and the large number of systems enable building a highly fault tolerant system. In addition, Big Data tools enable bringing together a different variety of data from diverse sources into a single data repository so that analytics can be done on the integrated but heterogeneous data.
Analytic Value Escalator
Gartner describes four different types of analytics capabilities based on the questions they ask of data and are ordered by level of difficulty and business value. These include descriptive, diagnostic, predictive and prescriptive analytics. These four analytics capabilities also vary in terms of how much human input is required to arrive at a decision and finally to take action. CEDA provides solutions to the Government at all levels of capa. Each of these capabilities is further elaborated below:
- Descriptive Analytics - The first step in analytics is always to understand what happened so that appropriate action can be taken. Invariably, the question is answered by various key performance indicators, queries and reports. Examples may include number of beneficiaries by region, average service level across districts etc. This capability requires human input at all levels including interpreting the results, taking a decision and finally acting on the decision. Descriptive statistics, KPI monitors, dashboards etc. are some of the tools that are useful in performing this type of Analytics.
- Diagnostic Analytics - Descriptive Analytics prompt the users to ask more questions in an attempt to find out the reasons for outliers or specific trends. Diagnostic Analytics attempts to find answers to these questions through more drill-down analysis and analyzing the relationships with other data. For e.g., if the service level in a district is poor, then the questions that need to be answered may include which offices in the district are performing poorly, whether the number of applications received in the district are large and finally whether there is sufficient manpower posted in the districts. A 3600 view of the district in terms of related data would provide a diagnostic capability to the decision maker making it easier for him to reason about why and how something has occurred. OLAP cubes, dashboards giving 360 degree view, correlation analysis etc. are some of the techniques that are used to carry out diagnostic analytics. Here again, user engagement is very high; however, the tools and techniques make it easier and faster to perform the analytics.
- Predictive Analytics - This capability answers the question “What will happen?” It uses statistical and machine learning algorithms to provide the decision makers a peek into the future so that they can take proactive action to ensure desirable outcomes. For some, predictive analytics may be a natural step from descriptive and diagnostic analytics to understand whether the current trends or behaviour will continue into the future or not. In other cases, it may be a natural business need such as forecasting the future prices of commodities so that corrective action can be taken well in time. Predictive analytics algorithms use a two stage process to arrive at the prediction: first a training stage where historical data is used to train and build a model; second, an execution stage where the model is used to make the prediction. Examples of predictive analytics include predicting whether a taxpayer will default or not based on a model built on historical behaviours of defaulters. Another example is forecasting the revenue collection, commodity prices, no. of applications that will be received for a particular service etc. Techniques such as regression analysis, time series analysis, neural networks, logistic regression, random forests, ensemble models etc. are used in predictive analytics. In predictive analytics, user’s input in building the model and predicting is considerably reduced; however, the decision to act based on the predictions is still vested with the user.
- Prescriptive Analytics - Prescriptive analytics takes the capability to a whole new level by providing the decision maker with the best decision within the framework of a given set of objectives and constraints. It can either provide a decision based on which the decision maker may take a call to act or alternatively automate the action itself. It invariably uses complex optimization algorithms to arrive at a decision given a set of constraints. Prescriptive Analytics is often used in conjunction with predictive analytics as any decision for the future will have to take into consideration the prediction of the future scenario. An example of prescriptive analytics can be identifying the go down from which a fair price shop should pick up the food grains given the constraints of travel time and cost, availability of food grains based on the predicted pick up by other fair price shops in the go downs etc. Techniques used in prescriptive analytics include various optimization algorithms such as liner programming, mixed integer programming, game theory etc.
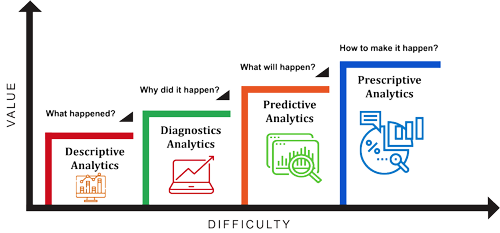
As we move up the Analytics ladder, both complexity and value increase. However, each of the four analytics capabilities address different stages of the decision process and hence should be used in combination to build a mature culture of fact-based, data driven decision making.
